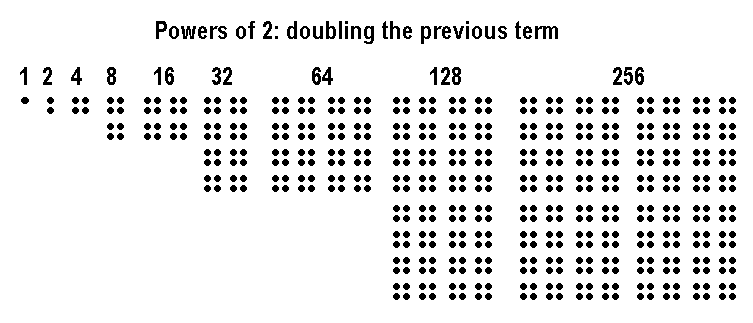
Riffing off a scenario at WRSA, the concept of logarithmic growth came up.
If you're RainMan with math, go watch Wapner, and skip the following.
If not, let me, as a non-mathematician, take a whack at it, as it relates to Ebola, and why you should know or care.
(And for those who'll bitch at me in Comments with degrees from MIT and CalTech, I feel your pain. After suffering through four, yes four math-incompetent nursing professors trying to teach Medication dosage calculations(!!), I noted aloud that having nurses teach math was like asking garbagemen to teach physics. Especially when the same university had perfectly adequate math professors already on staff. But I digress. Suffice it to say, you're stuck with a nurse teaching math here. If it makes you feel better, I never bounce a check.)
Quick and dirty: the earthquake Richter scale is base-10 logarithmic.
I.e., A 5.0 is 10 times bigger than a 4.0, a 6.0 is 100 times bigger than a 4.0, etc.
If you tried to straight line plot a logarithmic event, either the right side would require a piece of paper 20 feet tall, or the left side increases will be nearly flat unless examined under a microscope.
Like Mercator for maps, it's a good (not perfect) way to make things fit on a flat square/rectangular piece of paper small enough to hold in your hand.
The actual
Wikipedia page for this Ebola outbreak has log scales for reference: instead of the rocket launch reverse parabola on the straight-line scales, the trend line seen is almost exactly 45 degrees up and right, indicating an almost perfect logarithmic R-naught of 2.
(Any departures owe more to shoddy math and stat collection than to any flaws in the disease's ability to spread.
Nota bene the graph at top is an
old one for this very outbreak, as we now have
nearly triple that number of cases, and triple that again of likely official ones, i.e. pushing 40,000 cases.
To see a more current graph, with projections to the bitter end, Frozen Patriot has done one here:
http://bit.ly/1wdMzgG
I'd post it pictorially , but Blogger won't read the image. Go look for yourself.
h/t to Frozen Patriot for the work!)
100 new cases a week of something isn't that big a deal; we have 100 homicides in this country every few days, with no danger of running out of people. But if the homicide rate went logarithmic every month, in a year's time we'd be looking at 400,000 homicides a month. By mid-October of Year Two the homicide rate is larger than the population of the US, i.e. everyone's dead.
Ebola, playing with the entire planet, gets 33 doublings to get from 1 case to the 7.7B people on earth, less 10-25% or so survivors. Which would take the world's population back to where it was around 1700, more or less. It would take US population back to the 31M we had in 1860, except now those 31M would be distributed thinly in all 50 states. Move your state's population decimal one place to the left, and that's where it'll be if Ebola keeps on marching at logarithmic growth worldwide. If we keep it out, we stop that from ever getting a toehold to start.
That's why travel bans and quarantines matter!
People wonder why they should believe the graph. Fair enough. As far as suspicion, the graphists above has done the same thing the editors at Wikipedia did: plotted the numbers, and literally connected the dots. The graph is only as good as the data.
If the doublings speed up, the line goes farther to the right, faster. If we slow the speed of spread, it doesn't. Currently, Ebola is doubling every 2-4 weeks, depending on the country we're talking about. The average overall is every three weeks. If we even slowed that rate down to every four weeks, we'd add a
year to the planetary "Game Over" date. It was at every four weeks in July/August, for reference.
It doesn't flatten until we get the R-naught to less than 2.
It doesn't turn downward at all until we have a treatment(s) or vaccine that starts cutting the R-number to less than 1.
For smallpox and polio, that took 5900 years or so of human history.
We don't have to replicate that, but it gives you an idea of what has to be accomplished.
We've been trying to do it with HIV/AIDS for decades, with zero success, because it mutates rapidly and becomes resistant to our efforts.
Hopefully Ebola doesn't mutate as fast as we come up with something to kill it, and a vaccine will work on it for more than five minutes. If not, we're boned.
What that means for our chances at getting ahead of this disease:
If aggressive fluid therapy in the initial day or two pulls the fangs out this disease, that would be HUGE. We're still learning. In the US, we only have an insignificant number of cases, with a lot of other variables in play, so we still don't know.
And we wouldn't know that before now, because they've never done that in Africa (no capabilities or resources) and still don't, and most people died before anyone could do much of anything, including the medical staffs.
Math teachers may leave red pencil marks in Comments now.


